Category: Move Up Buyers

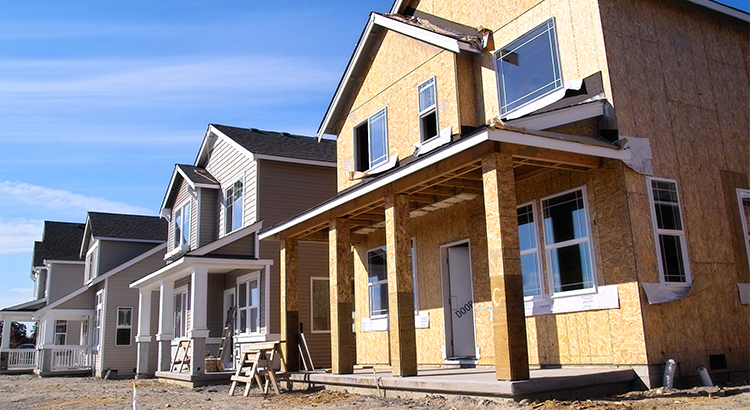
New Home Sales Up 12.7% From Last Year

According to the latest New Residential Sales Report from the Census Bureau, new construction sales in August were up 3.5% from July and 12.7% from last year! This marks the second consecutive month with double-digit year-over-year growth (12.8% in July). The report also showed that builders have ramped up construction with an increase in new construction starts and completions. The summer months are often a busy time for builders as they capitalize on the warmer weather to be able to finish projects. Below is a table showing the change in starts, completions, and sales from last August. Other notable news…

What’s Going On With Home Prices?

According to CoreLogic’s latest Home Price Insights Report, national home prices in August were up 5.5% from August 2017. This marks the first time since June 2016 that home prices did not appreciate by at least 6.0% year-over-year. CoreLogic’s Chief Economist Frank Nothaft gave some insight into this change, “The rise in mortgage rates this summer to their highest level in seven years has made it more difficult for potential buyers to afford a home. The slackening in demand is reflected in the slowing of national appreciation, as illustrated in the CoreLogic Home Price Index.   National appreciation in August…

The True Cost of NOT Owning Your Home

Owning a home has great financial benefits, yet many continue to rent! Today, let’s look at the financial reasons why owning a home of your own has been a part of the American Dream for the entirety of America’s existence. Realtor.com reported that: “Buying remains the more attractive option in the long term – that remains the American dream, and it’s true in many markets where renting has become really the shortsighted option…as people get more savings in their pockets, buying becomes the better option.” What proof exists that owning is financially better than renting? 1. In a previous blog, we highlighted the…

Are We About to Enter a Buyers’ Market?

Home sales are below last year’s levels, home values are appreciating at a slower pace, and there are reports showing purchasing demand softening. This has some thinking we may be entering a buyers’ market after sellers have had the upper hand for the past several years. Is this really happening? The market has definitely softened. However, according to two chief economists in the industry, we are a long way from a market that totally favors the purchaser: Dr. Svenja Gudell, Zillow Chief Economist: “These seller challenges don’t indicate we’re suddenly in a buyers’ market – we don’t expect market conditions…

Should I Buy Now? Or Wait Until Next Year? [INFOGRAPHIC]

Some Highlights: The cost of waiting to buy is defined as the additional funds it would take to buy a home if prices & interest rates were to increase over a period of time. Freddie Mac predicts interest rates to rise to 5.2% by the third quarter of 2019. CoreLogic predicts home prices to appreciate by 5.1% over the next 12 months. If you are ready and willing to buy your dream home, find out if you are able to! Source: Keeping Current Matters Chrysti TovaniChrysti Tovani is a REALTOR® based in Fair Oaks, CA, serving the greater Sacramento area—including…

Are Home Prices Softening or Are They Falling?

We are beginning to see reports that more housing inventory is coming to the market and that buyer demand may not be increasing at the same pace it did earlier this year. The result will be many headlines written to address the impact that these two situations will have on home values. Many of these headline writers will confuse “softening home prices” with “falling home prices,” but there is a major difference between the two. The data will begin to show that home values are not appreciating at the same levels as they had over the last several years (softening…

How Much Has Your Home Increased in Value?

Home values have risen dramatically over the last twelve months. In CoreLogic’s most recent Home Price Index Report, they revealed that national home prices have increased by 6.2% year-over-year. CoreLogic broke down appreciation even further into four price ranges, giving us a more detailed view than if we had simply looked at the year-over-year increases in national median home price. The chart below shows the four price ranges from the report, as well as each one’s year-over-year growth from July 2017 to July 2018 (the latest data available).  It is important to pay attention to how prices are changing in your local market. The location of your…

4 Reasons to Sell This Fall [INFOGRAPHIC]

  Some Highlights: Housing inventory is still under the 6-month supply that is needed for a normal housing market. Buyers are often competing with one another for the listings that are available. Perhaps the time has come for you and your family to move on and start living the life you desire. Source: Keeping Current Matters Chrysti TovaniChrysti Tovani is a REALTOR® based in Fair Oaks, CA, serving the greater Sacramento area—including Orangevale, Carmichael, and nearby neighborhoods. She’s also a multimedia journalist and founder of I Love Fair Oaks, a local media platform spotlighting the people, places, and businesses that…

25% of Homes with a Mortgage are Now Equity Rich!

Rising home prices have been in the news a lot lately and much of the focus has been on whether home prices are accelerating too quickly, as well as how sustainable the growth in prices really is. One of the often-overlooked benefits of rising prices, however, is the impact that they have on a homeowner’s equity position. Home equity is defined as the difference between the home’s fair market value and the outstanding balance of all liens (loans) on the property. While homeowners pay down their mortgages, the amount of equity they have in their homes climbs each time the…

Home Prices: The Difference 5 Years Makes

CoreLogic recently released their Home Price Index Report. One of the key indicators used in the report to determine the health of the housing market was home price appreciation. CoreLogic focused on appreciation from July 2013 to July 2018 to show how prices over the last five years have fared. The graph below was created to show the 5-year change in price from July 2013 to July 2018 by price range. As you can see in the graph, the highest price appreciation occurred in the lowest price range with 48% growth, while the highest priced homes appreciated by 25%. This has been greatly…

Home Prices Have Appreciated 6.9% in 2018

Between 1987 and 1999, which is often referred to as the ‘Pre-Bubble Period,’ home prices grew at an average of 3.6% according to the Home Price Expectation Survey. Every month, the economists at CoreLogic release the results of their Home Price Insights Report, which includes the actual year-over-year change in prices across the country and their predictions for the following year. The chart below shows the forecasted year-over-year prices for 2018 (predictions made in 2017). According to their predictions, the average appreciation over the course of 2018 should be 4.8%, which is still greater than the ‘normal’ appreciation of 3.6%.…

NAR Reports Show It’s A Great Time to Sell!

We all realize that the best time to sell anything is when the demand for that item is high and the supply of that item is limited. The last two major reports issued by the National Association of Realtors (NAR) revealed information that suggests that right now continues to be a great time to sell your house. Let’s look at the data covered in the latest Pending Home Sales Report and Existing Home Sales Report. THE PENDING HOME SALES REPORT The report announced that pending home sales (homes going into contract) are down 2.3% from last year and have continued to fall on an annual…