
Existing Home Sales Slowed by a Lack of Listings [INFOGRAPHIC]
Chrysti TovaniChrysti Tovani is a Fair Oaks Real Estate Advisor, Transition Specialist, and the author of…

Chrysti TovaniChrysti Tovani is a Fair Oaks Real Estate Advisor, Transition Specialist, and the author of…
Some Highlights: Historically, the choice between renting or buying a home has been a tough decision….
![VA Home Loans by the Numbers [INFOGRAPHIC]](https://chrystitovani.com/wp-content/uploads/2018/11/20181109-STM-ENG-768x1400.jpg)
Some Highlights: The Veterans Administration (VA) Home Loan is a benefit that is available to more…
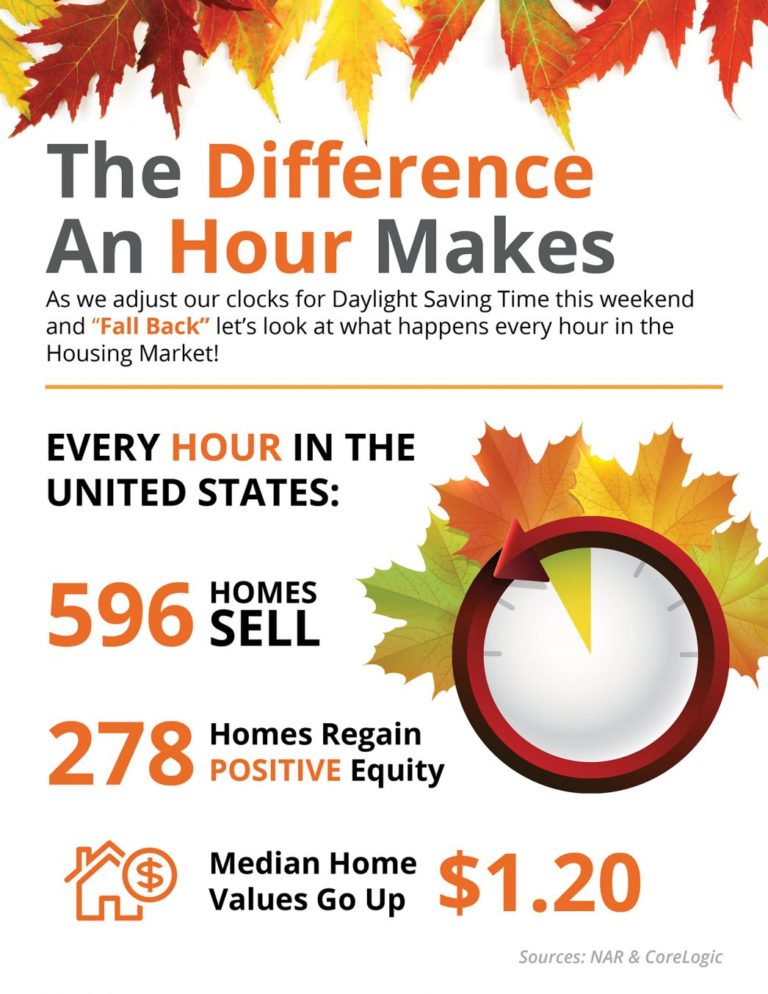
Every Hour in the US Housing Market: 596 Homes Sell 278 Homes Regain Positive Equity Median…
Some Highlights: Many potential homebuyers believe that they need a 20% down payment and a 780…
![20 Tips for Preparing Your House for Sale This Fall [INFOGRAPHIC]](https://chrystitovani.com/wp-content/uploads/2018/10/20181019-STM-ENG-1024x807-768x605.jpg)
Some Highlights: When listing your house for sale, your top goal will be to get the…

Some Highlights: Buying a home can be intimidating if you are not familiar with the terms…
Some Highlights: According to a study by GOBankingRates, it is cheaper to buy a home than…

Some Highlights: The cost of waiting to buy is defined as the additional funds it would…

Some Highlights: Housing inventory is still under the 6-month supply that is needed for a…

Some Highlights: According to a new survey from Open Listings, 62% of Americans ages 25-54 believe…
Some Highlights: Hiring a real estate professional to help you buy your dream home or sell…